Pandas Panels
In Pandas, if you want to contain any sort of data that is three dimensional, a panel becomes a potent contender. It is used less frequently than series or dataframes, but it is useful. The term panel data originates from somewhere in econometrics and is, in a way, responsible for the naming of the entire library: panel data.
While creating a panel and involving panel data you should take care to name all the three axes in such a way that they give some meaning to your operations.
If you plan on dicing or slicing a dictionary or collection of DataFrame objects, these names of axes might seem slightly strange to you. Following are the three axes,
-
items: Each item in this axis corresponds to one data frame, and this is called axis 0.
-
major_axis: This axis actually contains the rows or indexes of each of the data frames, and this is called axis 1.
-
minor_axis: This axis actually contains all the columns of each of the data frames, and this is called axis 2.
Creating a Panel in pandas
To create a Panel using pandas library, we use the Panel() function which has the following syntax,
import pandas as pd

pd.Panel(data, copy, dtype, items, major_axis, minor_axis)
Before we list down the ways to create a panel, here are the parameters involved in the panel function:
-
data: This is the data that the panel will represent.
-
copy: This is a Boolean type input that depicts whether the data will straightaway be copied from inputs or not.
-
dtype: This specifies the data type involved in the panel.
-
items: As discussed, each item in this axis corresponds to one data frame, and this is called axis 0.
-
major_axis: This axis actually contains the rows or indexes of each of the data frames, and this is called axis 1.
-
minor_axis: this axis actually contains all the columns of each of the data frames, and this is called axis 2.
The libraries we need to import for the creation of a panel are:
-
Pandas
-
NumPy, if you want to create a Panel object using the three-dimensional ndarray.
There are 3 ways of creating a Panel in the Pandas library. They are:
-
Creating a Panel from a three-dimensional ndarray with the use of optional axis labels
-
Creating a panel using a dictionary of data frame objects.
-
Creating a panel from a data frame by using the method of to_panel.
1. Creating a Panel from a three-dimensional ndarray
For better understanding of the code: collab.google.com
We can create a panel from a 3D ndarray because they both have three dimensions as the name suggests. While doing so also have the option to label our axes should we want to do so.
studyTonight_pan = pd.Panel(np.random.randn(5,10,5),

items = ['A' ,'B' ,'C', 'D','E'],

major_axis = pd.date_range('1/2/2019', periods=10), minor_axis=['1','2','3','4','5'])

print(studyTonight_pan)
Output:

There it is, you have created a Panel from a ndarray successfully.
2. Creating a panel using a dictionary of dataframe objects
A dictionary is a collection of objects in python which is generally unordered. It has indexes though and is changeable. A dataframe is a two dimensional data structure in python, so a dictionary of dataframes possesses three axes by that virtue; two of the dataframes, and one being the different dataframes themselves. Therefore, we get a panel from a dictionary of dataframes.
studyTonight_df = {'frame1': pd.DataFrame(np.random.randn(4,6)),
'frame2': pd.DataFrame(np.random.randn(6,7))}
pd.Panel(studyTonight_df)
Output:

3. Creating a panel from a dataframe by using the method of to_panel
Pandas provide us with a nifty little function called to_panel. This function helps us in converting an existing dataframe to a panel. It actually takes the long or stacked format of the dataframe and transforms it into a wider, three-dimensional format of a panel.
studyTonight_mul = pd.MultiIndex(levels=[['Grade 1', 'Grade 2'], ['X', 'Y']],

codes=[[0, 1, 0, 1], [0, 1, 1, 0]])
studyTonight_dat = pd.DataFrame({'Student 1': [98, 83, 89, 75], 'Student 2': [86, 97, 78, 79]}, index=studyTonight_mul)
studyTonight_dat

studyTonight_dat.to_panel()


Creation of an Empty Panel
There are many things which are not possible in python. Creating an empty panel, however, is possible. An empty panel finds its usage in several testing cases. Here we see that we can create an empty panel by simply not giving any data in it.
studyTonight_empty = pd.Panel()
studyTonight_empty

Operations on Panel Items
A panel allows numerous operations to be done on its data. Some of the most basic operations which we learn in any data structure are the selection, addition, and deletion of data. In this section, we will throw light on each one of them.
1. Selection of Panel items
Any data structure is ranked by its efficiency to manipulate data and the first step towards doing so is the selection of items. Panels provide us with comprehensive operations to select the desired items by using the correct parameters.
studyTonight_pan = pd.Panel(np.random.randn(5,10,5),
                        items = ['A' ,'B' ,'C', 'D','E'],
                        major_axis = pd.date_range('1/2/2019', periods=10),
                        minor_axis = ['1','2','3','4','5'])

print(studyTonight_pan['A'])
Output:

2. Addition of Panel Items
Another important part of data manipulation and analysis is the addition of new data, or old data at a different location. Any data structure should be efficient in doing so. Panels offer us an easy way to add the required items to the existing one.
studyTonight_pan['C'] = studyTonight_pan['A']+studyTonight_pan['B']
studyTonight_pan['C']
Output:

3. Deletion of Panel Items
Whenever there is any item which is out of place, or an item which we don’t need at all, the need arises for it to be deleted because it may mess with our results; not to mention the additional storage space it will consume. Panels offers us an easy way to delete the items we want without affecting the other items.
del studyTonight_pan['D']
studyTonight_pan
Output:

4. Panel transpose
One of the important functions involved in data manipulation is the transpose function. This function basically switches the axes of the panel in the manner we want it to. This is very useful when we have to move the data sets around regularly.
Before that, as we have done a lot of operations on the previous panel, we make a new one now.
studyTonight_pan = pd.Panel(np.random.randn(6,5,6),
                       items=['o' ,'p' ,'q', 'r','s','t'],
                       major_axis=pd.date_range('1/1/2019', periods=5),
                       minor_axis=['5','6','7','8','9','10'])
print(studyTonight_pan)
Output:

Now let's transpose it,
studyTonight_pan.transpose(1, 2, 0)

5. Data selection from a Panel
Do not have this confused with section 7a of our tutorial. That was the selection of items while this is the selection of data. As we have mentioned several times in this article, a data structure is as good as its data handling capacity. Panel takes the complex process of selecting data from a specific axis and brings it down to one line. Here we will see how (but before that we have to create another panel for clarity of function use):
# insert a code for creating a new panel here if required
a. Selection of an item
We can select individual items with a simple line of code by putting in the right parameters.
studyTonight_pan['o']
Output:

Error 404: Soul not found
b. Selecting a Major Axis
Similarly, we can select a major axis just with one line of code and the right parameters.
studyTonight_pan.major_xs(studyTonight_pan.major_axis[3])
Output:
1 2 3 4
J 0.550053 0.956819 -0.400523 -0.583020
K 0.836906 1.066107 -1.876660 0.044376
L -2.781268 1.682333 0.462075 -0.151477
M -0.536076 0.085945 -0.475268 -0.547530

c. Selecting a Minor Axis
Lastly, we can select a minor axis just with one line of code and the right parameters.
studyTonight_pan.minor_xs('7')
Output:

6. Deprecating a Panel
Pandas is a fast-growing library with an ever-increasing versatility. The efficient routines for the functioning and indexing of DataFrames, Series, and Panels have resulted in the complexity of codes. Nowadays a 3D Panel is quite uncommon when compared to a 2D DataFrame or a 1D Series for data analysis. The xarray package was developed especially for the support of the multidimensional analysis of a panel. Therefore we sometimes deprecate a panel to an xarray or a Multi-Index DataFrame.
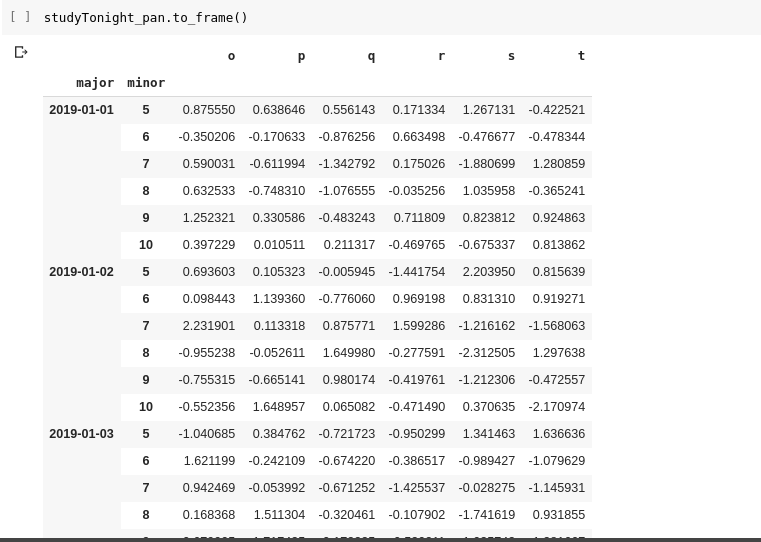
a. Deprecating to a Multi-Index DataFrame
studyTonight_pan.to_frame()
Output:
Conclusion
In this tutorial, we have learned about the various ways of creating a panel, the parameters required for doing so, performing basic operation on a panel, and how to deprecate an existing panel. If you have any queries regarding panels, feel free to comment in the comment section below.