Pandas DataFrame boxplot() Method
A boxplot often called a box and plot that displays the five-number summary of a DataFrame. The five-number summaries are the minimum value of the dataset, first quartile that is 25% of the dataset, median that is 50% of the dataset, third quartile that is 75% of the dataset, and the maximum value of the dataset. A box plot is a method for graphically depicting groups of numerical data through their quartiles.
In this tutorial, we will learn the python pandas DataFrame.boxplot() method that makes a box plot from DataFrame columns.
The below shows the syntax of the DataFrame.boxplot() method.
Syntax
DataFrame.boxplot(column=None, by=None, ax=None, fontsize=None, rot=0, grid=True, figsize=None, layout=None, return_type=None, backend=None, **kwargs)
Parameters:
column: str or list of str, optional. Column name or list of names, or vector.
by: str or array-like, optional. A column in the DataFrame to pandas.DataFrame.groupby(). One box-plot will be done per value of columns in by.
fontsize: float or str. Tick label font size in points or as a string (e.g., large).
rot: int or float, default 0. The rotation angle of labels (in degrees) with respect to the screen coordinate system.
grid: bool, default True. Setting this to True will show the grid.
layout: tuple (rows, columns), optional. For example, (3, 5) will display the subplots using 3 columns and 5 rows, starting from the top-left.
return_type: {‘axes’, ‘dict’, ‘both’} or None, default ‘axes’. The kind of object to return. The default is axes.
Example 1: Creating boxplot with DataFrame.boxplot() Method
Consider a simple example of how the DataFrame.boxplot() method works. Create a DataFrame and generate the boxplot by passing the name of the DataFrame column to the DataFrame.boxplot() method.
import pandas as pd
df = pd.DataFrame([['Abhishek',75,80,90], ['Anurag',80,90,95],['Bavya',80,82,85],['Bavana',95,92,92],['Chetan',85,90,89]], columns=['Name','Maths','Science','Social'])
print(df)
boxplot=df.boxplot(column=['Social'])
print(df['Social'].quantile([0.25,0.5,0.75]))
print(boxplot)
Once we run the program we will get the following output.

Example 2: Creating a boxplot with DataFrame.boxplot() method by grouping data from the column values
This example is similar to the previous one but first, it will group the DataFrame into different groups according to the by='DOB' parameter and then creates a boxplot for each DataFrame.
import pandas as pd
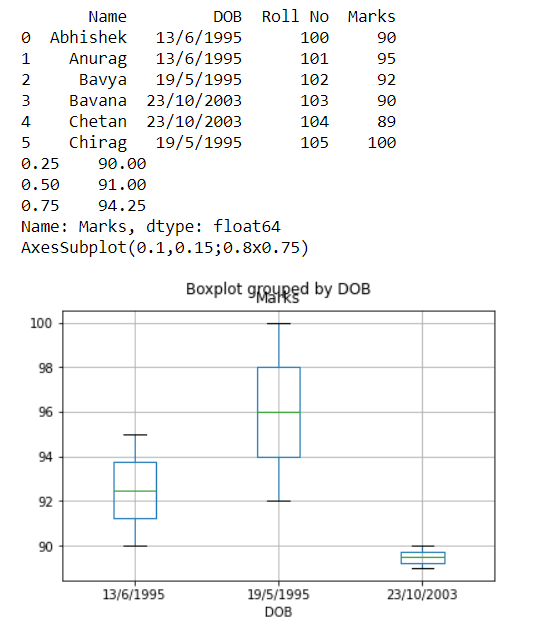
df = pd.DataFrame([['Abhishek','13/6/1995',100,90], ['Anurag','13/6/1995',101,95],['Bavya','19/5/1995',102,92],['Bavana','23/10/2003',103,90],['Chetan','23/10/2003',104,89],['Chirag','19/5/1995',105,100]], columns=['Name','DOB','Roll No','Marks'])
print(df)
print(df['Marks'].quantile([0.25,0.5,0.75]))
boxplot=df.boxplot(column=['Marks'],by='DOB')
print(boxplot)
once we run the program we will get the following output.
Example 3: The DataFrame.boxplot() method by customizing the boxplot using fontsize, rot, and grid parameters
We can customize the boxplot using fontsize, rot and grid parameters and the below example shows the same.
import pandas as pd
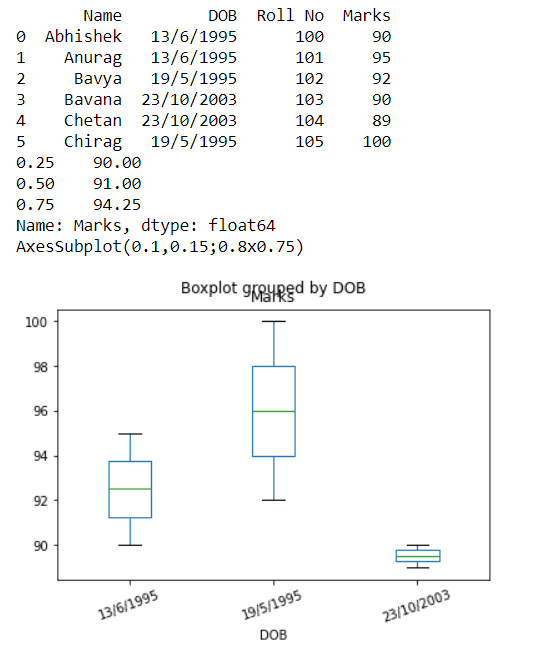
df = pd.DataFrame([['Abhishek','13/6/1995',100,90], ['Anurag','13/6/1995',101,95],['Bavya','19/5/1995',102,92],['Bavana','23/10/2003',103,90],['Chetan','23/10/2003',104,89],['Chirag','19/5/1995',105,100]], columns=['Name','DOB','Roll No','Marks'])
print(df)
print(df['Marks'].quantile([0.25,0.5,0.75]))
boxplot=df.boxplot(column=['Marks'],by='DOB',grid=False, rot=20, fontsize=10)
print(boxplot)
once we run the program we will get the following output.
Example 4: The DataFrame.boxplot() method by customizing the layout Parameter
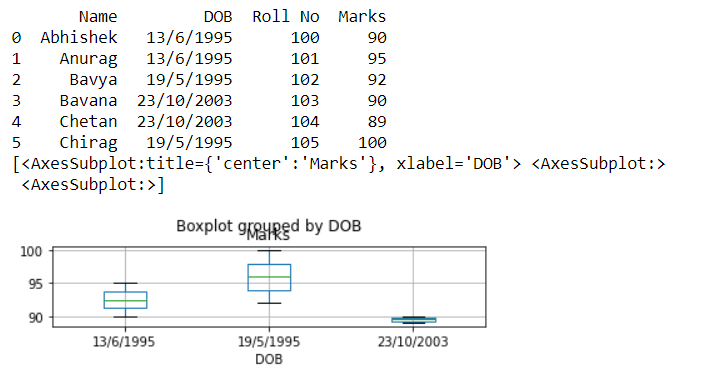
We can customize the boxplot using the layout parameter and the below example shows the same. It will display the subplots using 3 columns and 1 row.
import pandas as pd
df = pd.DataFrame([['Abhishek','13/6/1995',100,90], ['Anurag','13/6/1995',101,95],['Bavya','19/5/1995',102,92],['Bavana','23/10/2003',103,90],['Chetan','23/10/2003',104,89],['Chirag','19/5/1995',105,100]], columns=['Name','DOB','Roll No','Marks'])
print(df)
boxplot=df.boxplot(column=['Marks'],by='DOB',layout=(3,1))
print(boxplot)
once we run the program we will get the following output.
Conclusion
In this tutorial, we learned the python pandas DataFrame.boxplot() method to the DataFrame. We learned syntax, parameters, and passing different methods to the DataFrame.boxplot() method, we solved examples and understood the method.